
.eco Greenhouse Gas Emissions Report - 2025
2025 Fiscal Year
Published:
About this document
This report describes the boundaries, methodologies, assumptions and key references used to estimate the Scope 1, 2 and 3 greenhouse gas (GHG) emissions for the operations of Big Room Inc. during its 2025 fiscal year. This document is written to meet the reporting and disclosure requirements of ISO 14064 (International Standard for GHG Emissions Inventories and Verification). The methodology, calculation and reporting statements have been validated by Inhabit.
Reporting period
The reported GHG emissions are based on business operations during Big Room’s 2025 fiscal year: October 1, 2024 to September 30, 2025. This is the fourth year that Big Room has estimated its greenhouse gas emissions, with the 2022 fiscal year serving as the baseline year. Emission reductions are calculated relative to the 2022 base year.
2022 was chosen as the baseline year as it was the first year that emissions were calculated. 2022 was typical with respect to business operations and the operations in 2025 are largely consistent with those of 2022.
In this and subsequent emissions reports comparisons are made to this base year. The base year recalculation policy is to recalculate the base year and prior year emissions for changes that meet a significance threshold of 5% of base year emissions. Baseline emissions were recalculated in the 2024 fiscal year due to a methodology update that met this significance threshold. For the 2025 fiscal year, while there are some adjustments to calculations and expansion of scope, they do not meet the 5% significance threshold so the baseline was not recalculated.
Reporting boundary
Big Room follows an operational control approach when defining boundaries for emissions calculations. We consider direct and indirect emissions associated with Big Room’s core business, the operation of the .eco domain registry and Ecolabel Index.
Big Room does not operate from a physical office. As of 2020, all work is performed remotely from the homes of Big Room staff. As a result, Big Room has chosen to include 100% of the electricity and fossil gas use in our homes in our Scope 3 emissions under Category 7: Employee commuting. We exclude emissions from other activities occurring within the home, such as the purchase of food or goods for personal use, garbage or wastewater from our homes, home repairs or personal vehicle use as none of these pertain directly to Big Room’s business.
As Big Room provides digital products (domain names) as our core business, we include the estimated emissions from by powering their operations within our Scope 3 emissions. These digital services operate from data centers run by our partners. We estimate our share of emissions associated with powering those digital services. If our supplier provides primary emissions or usage data, we use that. Otherwise, we estimate the emissions based on standard methodologies defined below.
We also account for emissions associated with any business trips and travel we do in operation of the business.
FY2025 emissions
The tables below describe our annual emissions for the 2025 fiscal year by scope versus the 2022 baseline.
Total emissions by scope
| Scope | FY2025 emissions (t CO2e) |
Baseline emissions (t CO2e) |
% change vs baseline | Details |
|---|---|---|---|---|
| Scope 1 | 0 | 0 | 0% | Big Room has no leased or owned company facilities or vehicles |
| Scope 2 | 0 | 0 | 0% | Big Room has no leased or owned company facilities or vehicles |
| Scope 3 | 3.96 | 4.05 | -2.12% | Includes emissions from Categories 1, 6, 7, 11 |
| Total | 3.96 | 4.05 | -2.12% |
As described above, Big Room does not directly own or lease any facilities, so our Scope 1 and 2 emissions are 0. All estimated emissions are included in Scope 3, so that is our principal area of focus and reporting. We break down the Scope 3 emissions in the table below.
Scope 3 emissions by category
| Source | FY2025 emissions (t CO2e) |
Baseline emissions (t CO2e) |
% change vs baseline | Details |
|---|---|---|---|---|
| Category 1: Purchased goods and services | 0.17 | 0 | - | Includes use of office productivity software and business meals. |
| Category 2: Capital goods | 0 | 0 | - | No capital goods were purchased. |
| Category 3: Fuel and energy related activities | 0 | 0 | - | No fuels and energy directly purchased for digital goods. |
| Category 4: Upstream transportation and distribution | 0 | 0 | - | No transportation and distribution required. |
| Category 5: Waste generated in operations | 0 | 0 | - | Emissions associated with waste or wastewater from our households are excluded. |
| Category 6: Business travel | 0.11 | 0 | - | Includes company trip to ICANN82 in Seattle. |
| Category 7: Employee commuting | 3.48 | 3.81 | -8.49% | Includes home energy use. |
| Category 8: Upstream leased assets | 0 | 0 | - | No leased assets. |
| Category 9: Downstream transportation and distribution | 0 | 0 | - | No transportation and distribution required. |
| Category 10: Processing of sold products | 0 | 0 | - | No intermediate processing required for digital goods. |
| Category 11: Use of sold products | 0.20 | 0.24 | -17.80% | Includes digital services directly related to providing domain names to registrants. |
| Category 12: End-of-life treatment of sold products | 0 | 0 | - | No disposal required for digital goods. |
| Category 13: Downstream leased assets | 0 | 0 | - | No leased assets. |
| Category 14: Franchises | 0 | 0 | - | No franchisees. |
| Category 15: Investments | Excluded from scope, not material | - | - | No major investments held. |
| Total Scope 3 | 3.96 | 4.05 | -2.12% |
For our Scope 3 emissions we have tried to include all emissions sources that are material to the operations of our business.
Quantification methodology
This section outlines the methodologies used in the quantification of emitted emissions and the associated emissions factors and their sources.
Category 1: Purchased goods and services
This category includes:
- purchased digital subscriptions, such as office productivity software, that are not fundamental to the operation and delivery of our core product (.eco domain names)
- meals consumed for business meetings or trips
For digital services, we use emissions or usage data provided by our suppliers when it's available. If it's not, we estimate emissions using a cost-based emissions intensity factor from the US EPA Supply Chain Greenhouse Gas Emission Factors (v1.3). This dataset gives emission intensity factors by US dollar for businesses based on their NAICS code. We use the following factor:
- 541519 - Other Computer Related Services emissions: 80g CO2e/$USD
For business meals, we use the same US EPA dataset to obtain the cost-based emissions intensity factor full-service restaurants:
- 722511 - Full-Service Restaurants: 194g CO2e/$USD
The quantification of emissions using cost-based intensity factors follows the formula:
- Estimated emissions (CO2e) = cost of product or service ($USD) * intensity factor (CO2e/$USD)
Category 6: Business travel
This category includes transportation and accommodation for business trips. As part of our sustainability policy, we give preference to attend events virtually rather than travelling to attend in person. However, occasionally it is highly valuable to be there in person. We deemed that was the case for the ICANN82 meeting in Seattle in March 2025. As it was a relatively short trip for us, we were able to travel to Seattle by train. The estimated emissions in this category include our trip to the event and our accommodation in Seattle.
For train travel, we used a distance-based emissions factor from the US EPA GHG Emission Factors Hub:
- Intercity-rail other routes: 0.149kg CO2e/passenger mile
For hotel accommodation, we used a room night-based intensity factor from the Greenview Hotel Footprinting Tool (v1.1) via Climatiq.
- 3-star hotel in Seattle, WA: 10.84kg CO2e/room night
Category 7: Employee commuting
As we work exclusively remotely, we are accounting for 100% of the electricity and fossil gas use in the homes of Big Room staff. Our homes are located in British Columbia, Canada and we are using emissions factors provided by the provincial or federal government:
- BC Government electricity emission intensity factor for integrated grid properties (2024): 9.9g CO2e/kWh
- Canadian Government natural gas emissions intensity for BC: 1966g CO2e/m3
Emissions are quantified based on the monthly billing data from our homes multiplied by the associated emissions intensity factors.
Category 11: Use of sold products
For this category, we include the estimated emission associated with the digital services that are instrument to operating the .eco top-level domain. This includes web sites and applications, DNS infrastructure and other digital services that support .eco registrars, registrants and prospects.
If primary emissions reporting data from our partners is available, we use that. If it's not available, we follow the guidance of the Sustainable Web Design model v4 (SWD) to estimate the footprint of these digital services. The SWD model uses data transferred from a service across the Internet as a proxy for estimating emissions. When the data is served from or processed at a known location (such as a data center), we use the emission factors for local electricity generation to calculate the data center component of the footprint. When the location is unknown or broadly distributed, we use a default emissions factor recommended by the model.
Registry system and authoritative DNS
CIRA operates the registry system and authoritative DNS for the .eco top-level domain. Last year for the first time, CIRA published its GHG footprint for its 2024 fiscal year. Previously we had been using SWDv4 to estimate .eco's share of CIRA's footprint. Now that we had access to primary data, we've switched to using it. Remarkably, the estimates from SWDv4 and CIRA's primary data align quite closely.
CIRA has published a delegation intensity metric that calculates the average emissions associated with each domain that they handle DNS requests for. This allows us to calculate our share of their emissions based on the number of delegated .eco domains that they serve through their DNS infrastructure.
We are using the following intensity metric for the calculation:
- CIRA delegation intensity (2025): 16 gCO2e/delegated domain
This intensity metric is based on their FY2025 GHG report which has not yet been published at the time of this report.
.eco websites
Big Room operates several websites in service of its business, including the .eco profile system and the .eco retail site. The emissions associated with these websites are quantified using SWDv4.
These calculations have not changed since last year when we switched from version 3 to version 4 of the Sustainable Web Design method. However, they are, in part, derived from the intensity of electricity generated in the regions where our services operate. These regional electricity emissions intensity factors have been updated for this year:
- Oregon, US: 288.15 gCO2e/kWh (EPA eGrid 2023 NWPP subregion - 2025)
- Quebec, Canada: 1.7 gCO2e/kWh (Canadian Government emissions factors - 2024)
Key assumptions and Methodological Changes
There were five main changes in the FY25 GHG report compared with last year's:
- We switched from SWDv4 to using primary data for quantifying our share of CIRA's GHG emissions.
- The natural gas consumption intensity factor provided by the BC Government was updated to the latest value (2024). Also the electricity emissions factor for Oregon was updated using the latest EPA eGrid value (2025). No other emissions factors changed in this reporting period.
- Business travel was included for the first time. This is the first time that the company embarked on a business trip since the baseline year, so this is not missing from prior reports.
- Additional digital services were included that had not previously been included due to a lack of primary reporting data. This year, we used a spend-based approach to account for their emissions. It did have the effect of increasing our footprint by approximately 0.13 tCO2e. However, as this was not above our 5% materiality threshold, we decided not to recalculate our baseline.
- We moved Google Workspace which had previously been included in Category 11 to Category 1. We made this change as Google Workspace is not fundamental to the operation of the business: providing domain names to registrants.
Emissions reduction
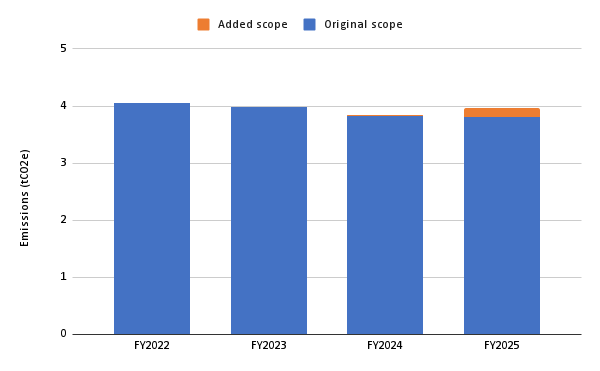
The following table shows our emission and reduction targets over the past 4 years.
| Year | Total emissions (t CO2e) |
Target reduction % | Actual reduction vs baseline | Details |
|---|---|---|---|---|
| FY2022 | 4.05 | - | - | Baseline year — no set reduction target |
| FY2023 | 3.99 | -4% | -1.4% | Reduction due to optimizing websites. Not as large as forecast due to rebaselining in FY2024 |
| FY2024 | 3.84 | -8% | -5.1% | Reduction due to fuel switching of home office appliances |
| FY2025 | 3.96 | -8% | -2.1% | Increase due to inclusion of additional paid services under Category 1 |
Our goal for FY2025 was to maintain the same level of emissions as for FY2024. We did not have any major reduction actions planned and we anticipated that we would see some increase in emissions due to the planned business trip.
The increase in reported absolute emissions this year primarily reflects improvements in data quality and the inclusion of additional emissions categories, rather than a material increase in underlying operational emissions. This additional scope added an extra 0.13 tCO2e to our footprint. Without those added emissions, we would have been exactly on track to meet the same emissions level as last year.
For the 2026 fiscal year, we are striving to further improve the energy efficiency of home offices. That could lead to a reduction of 2.0 - 3.5 tCO2e (50%-86%) from our footprint depending on the scope of work completed.
Here is a summary of our planned and completed reduction actions.
| Action area | Action description | Timeline | Expected reduction (tCO2e) | Status |
|---|---|---|---|---|
| Home office | Fully electrify home office / Eliminate natural gas use | 2023-2027 | 3.5 | In progress |
| Digital services | Work with suppliers to obtain primary emissions data and encourage their path to net-zero | 2023-2030 | 0.3 | Active |
These actions will eliminate over 90% of existing emissions. Residual emissions will require further investments in energy efficiency and renewable generation (e.g. solar panels) to achieve.
Emissions management and monitoring
Emissions will be recalculated as part of our annual assessment in October 2026. Detailed emissions calculations are included in a supplemental workbook that is updated at least annually as part of each assessment. Our auditing partners have reviewed and approved the detailed calculations.